User Journeys — See
Product Health Like a CXO

A canvas that turns requirements, tests, and defects into a single business view.

Hero Image
star star star star star star star star star star star star star star star star star

Built For Outcomes, Not Noise

For CXOs, Product & Engineering Leaders

See test progress, risk, and impact without diving into tools.

Built For CXO

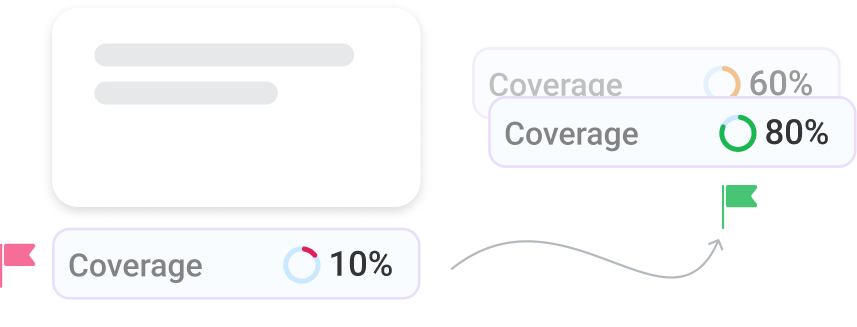
Connect quality to revenue

If “coverage” is red, your revenue is at risk. Fix the right thing, first.

Connect quality to revenue

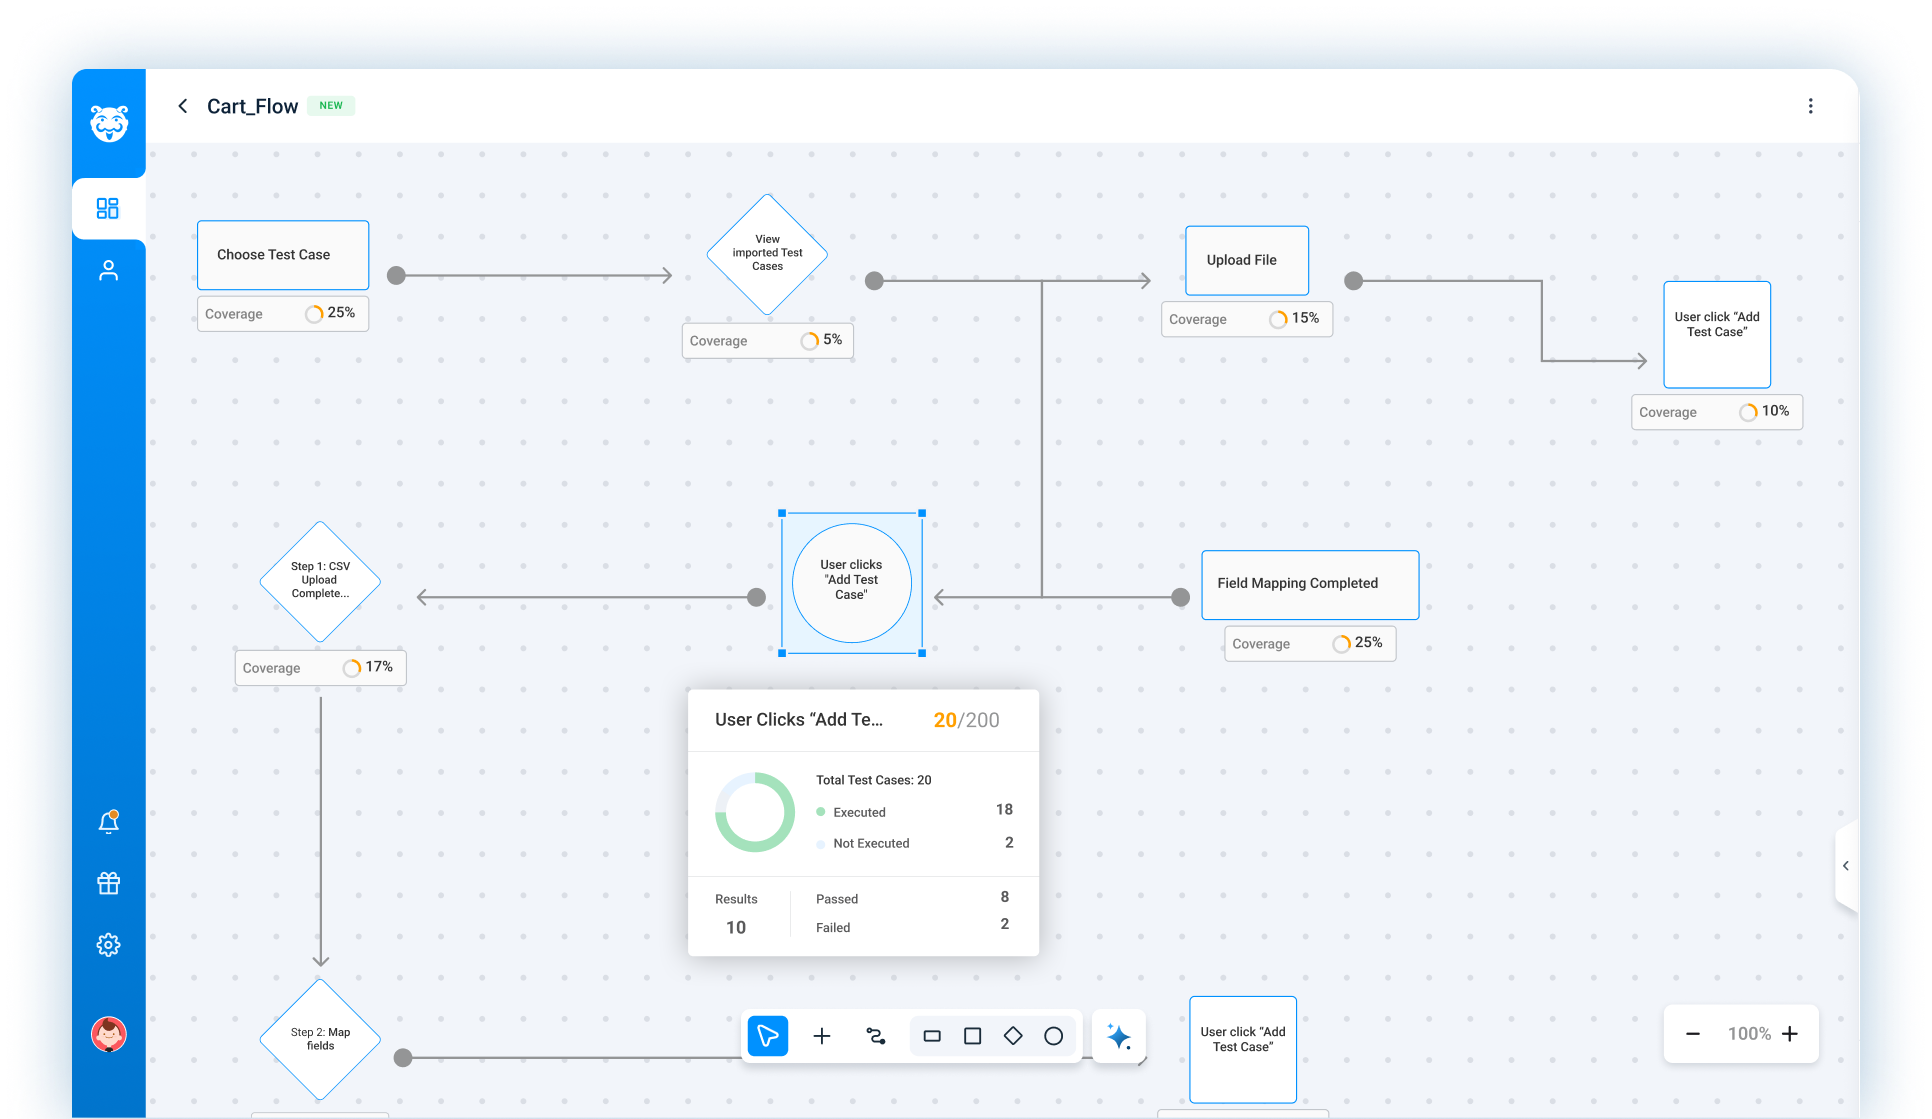
See Your Entire Product From Requirement To Release On One Live Canvas.

Built with Asura AI, designed for CXOs, your product’s health mapped automatically.

The Asura AI Chatbot

Start Requirements or Create Your Own

Edit and Design Your Canvas

Activity Timeline & Progress View

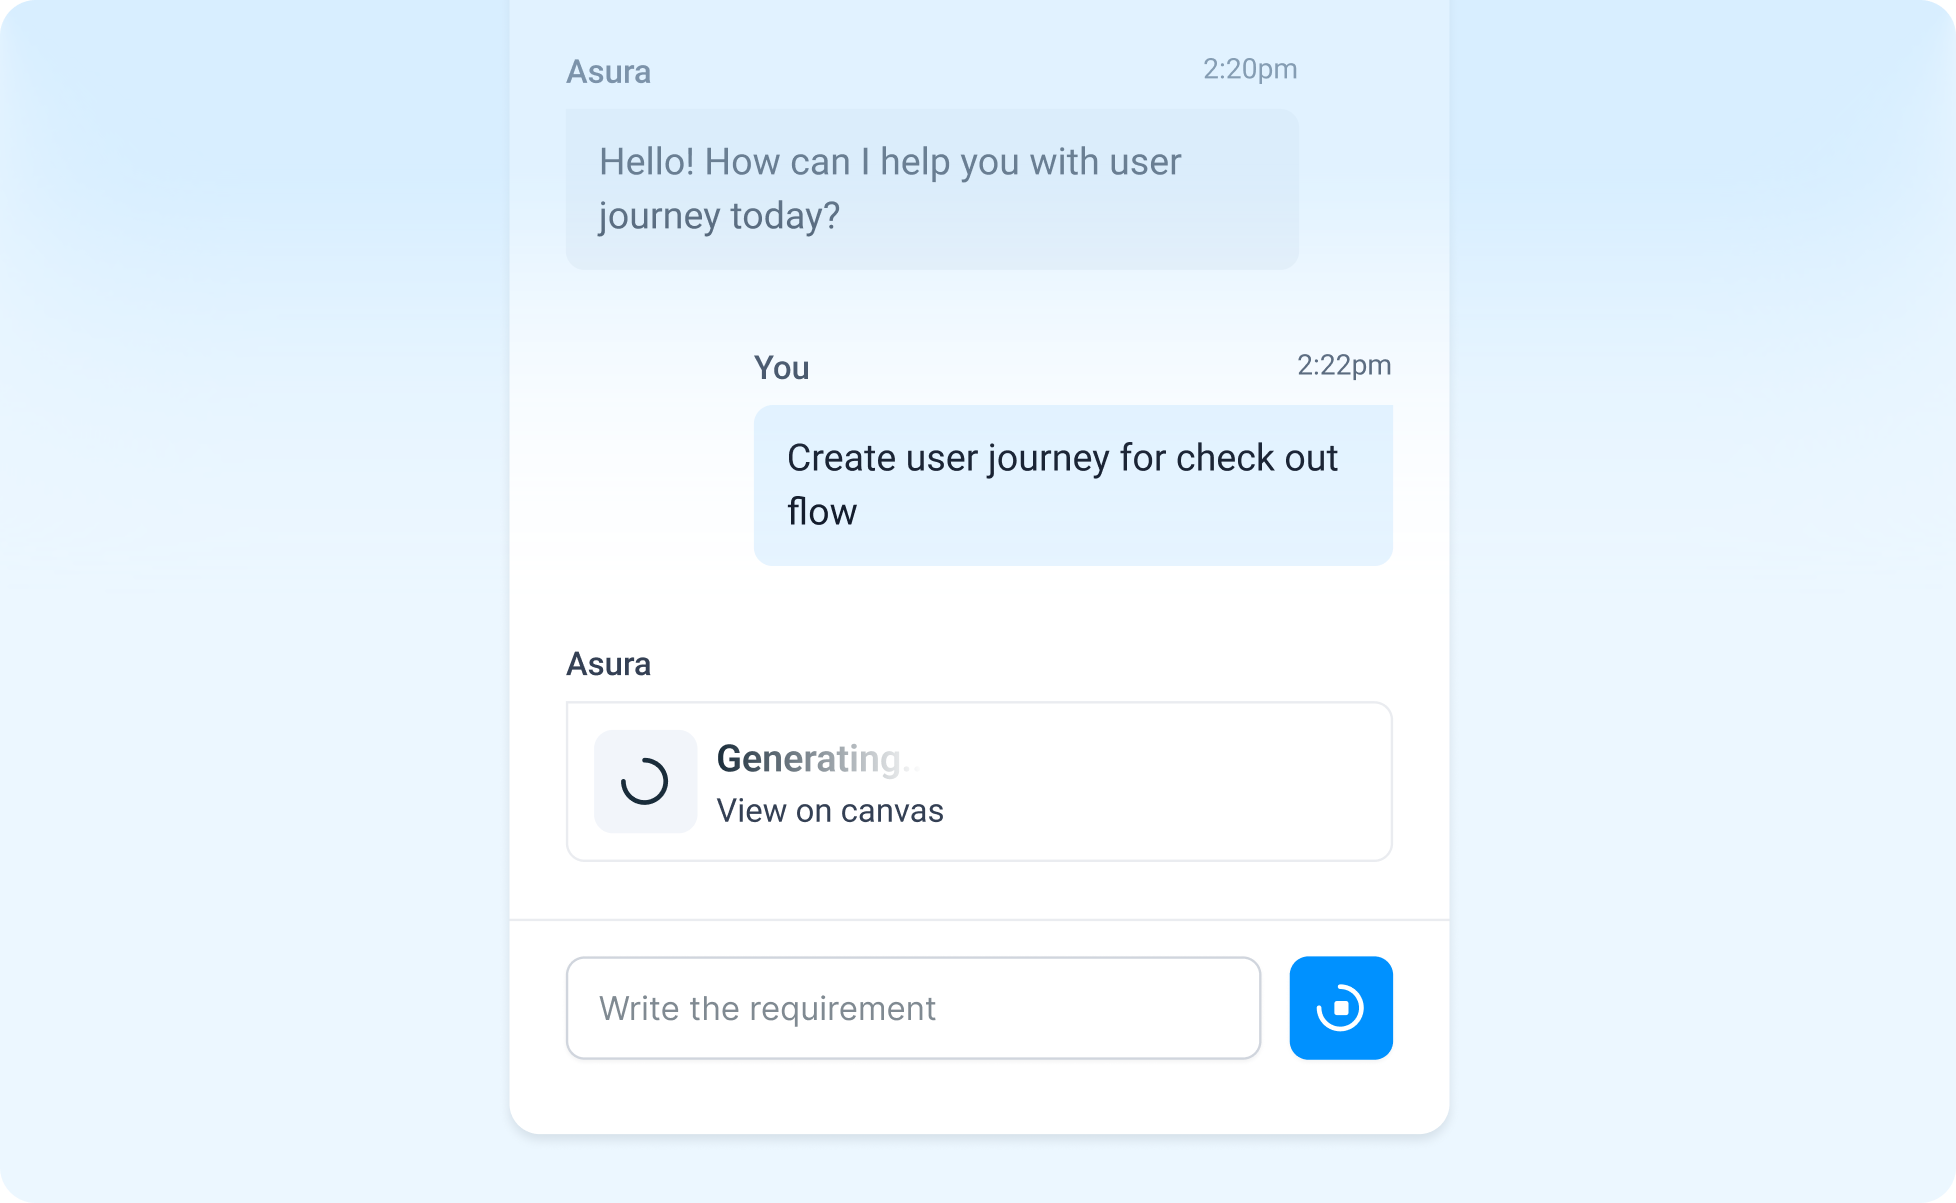
The Asura AI Chatbot

Your co-pilot for building journeys. Just describe what you want to monitor — Asura AI understands and creates the journey board for you. No setup, no searching through test cases.

icon-upload-document

Let Asura turn your thoughts into a map of product health.

Canvas Example 1

Start Requirements or Create Your Own

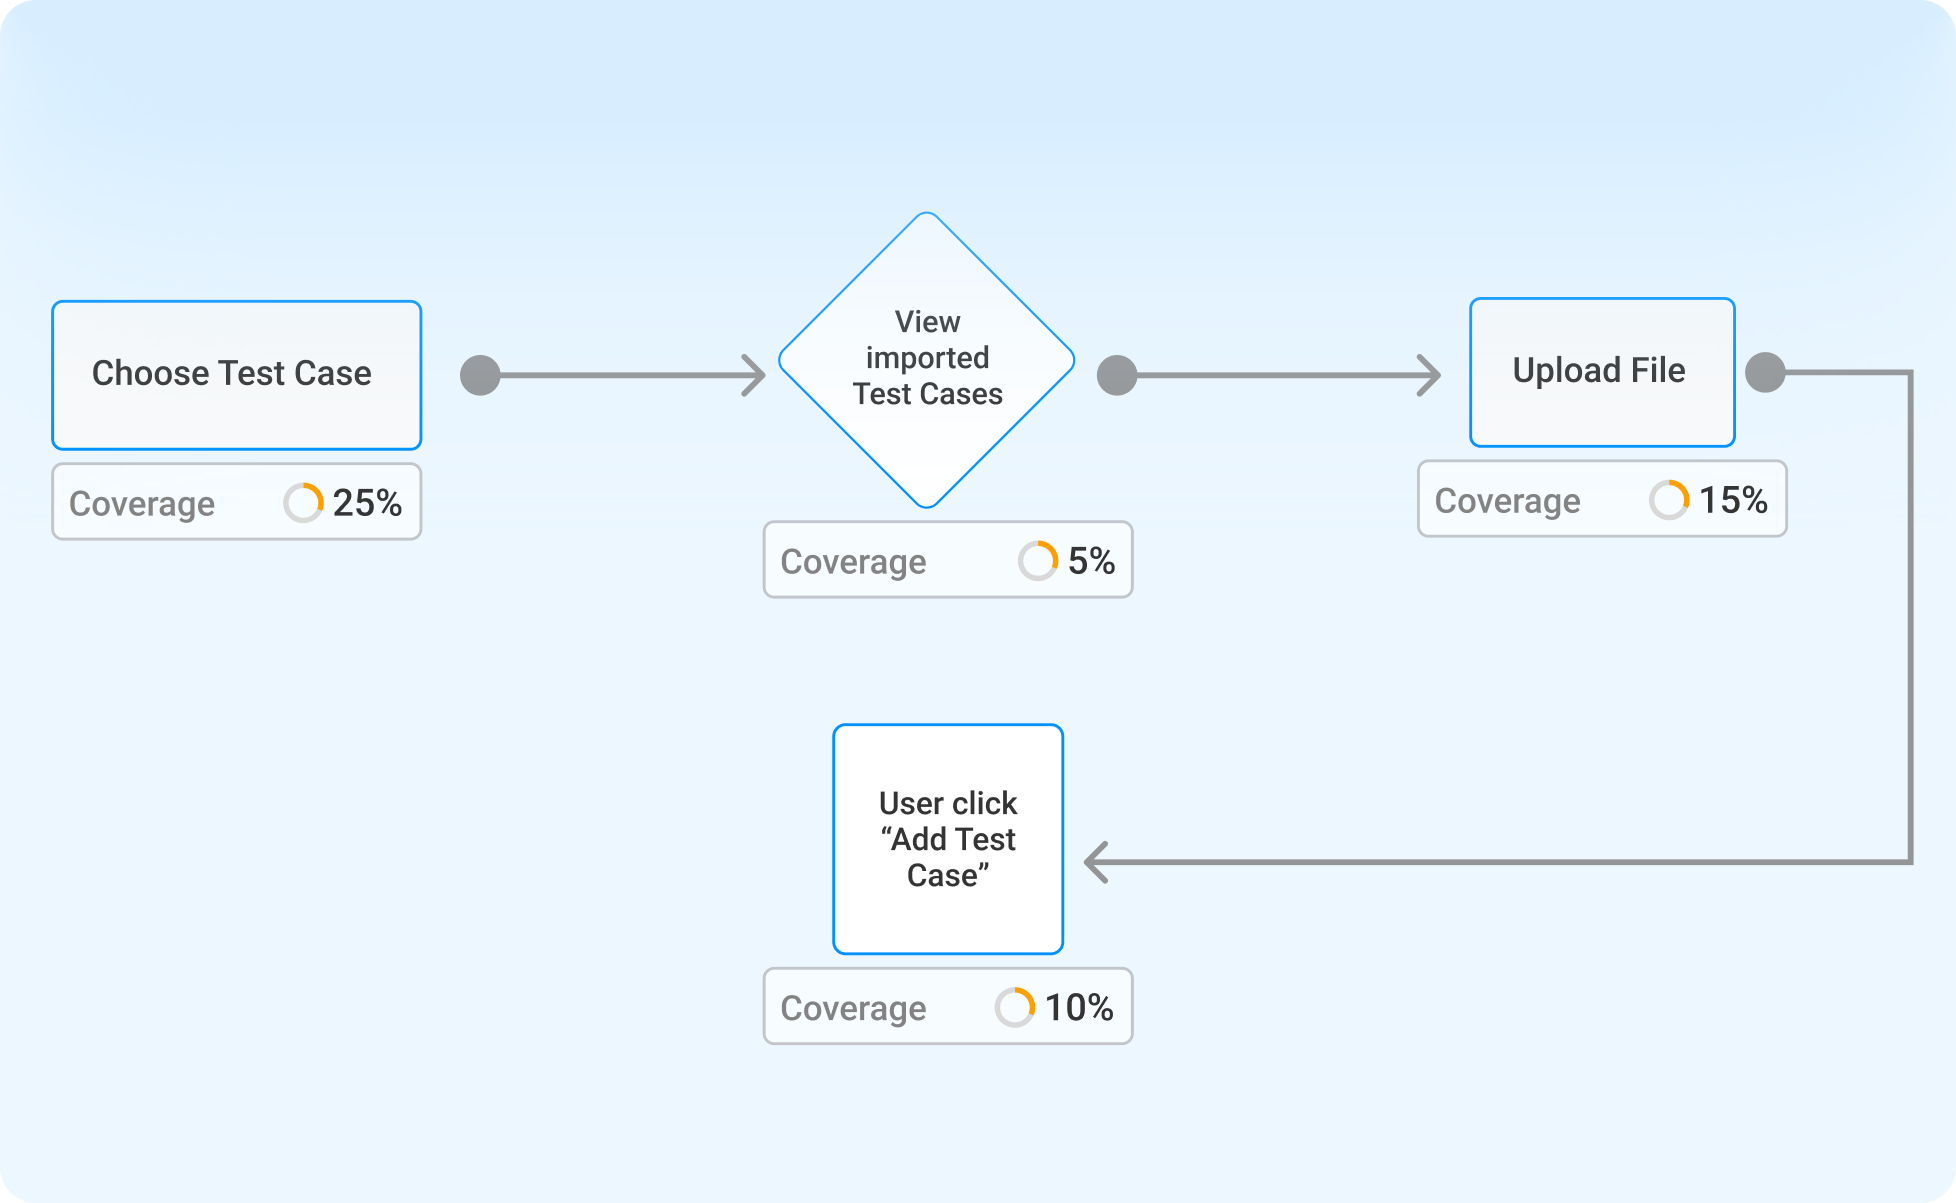
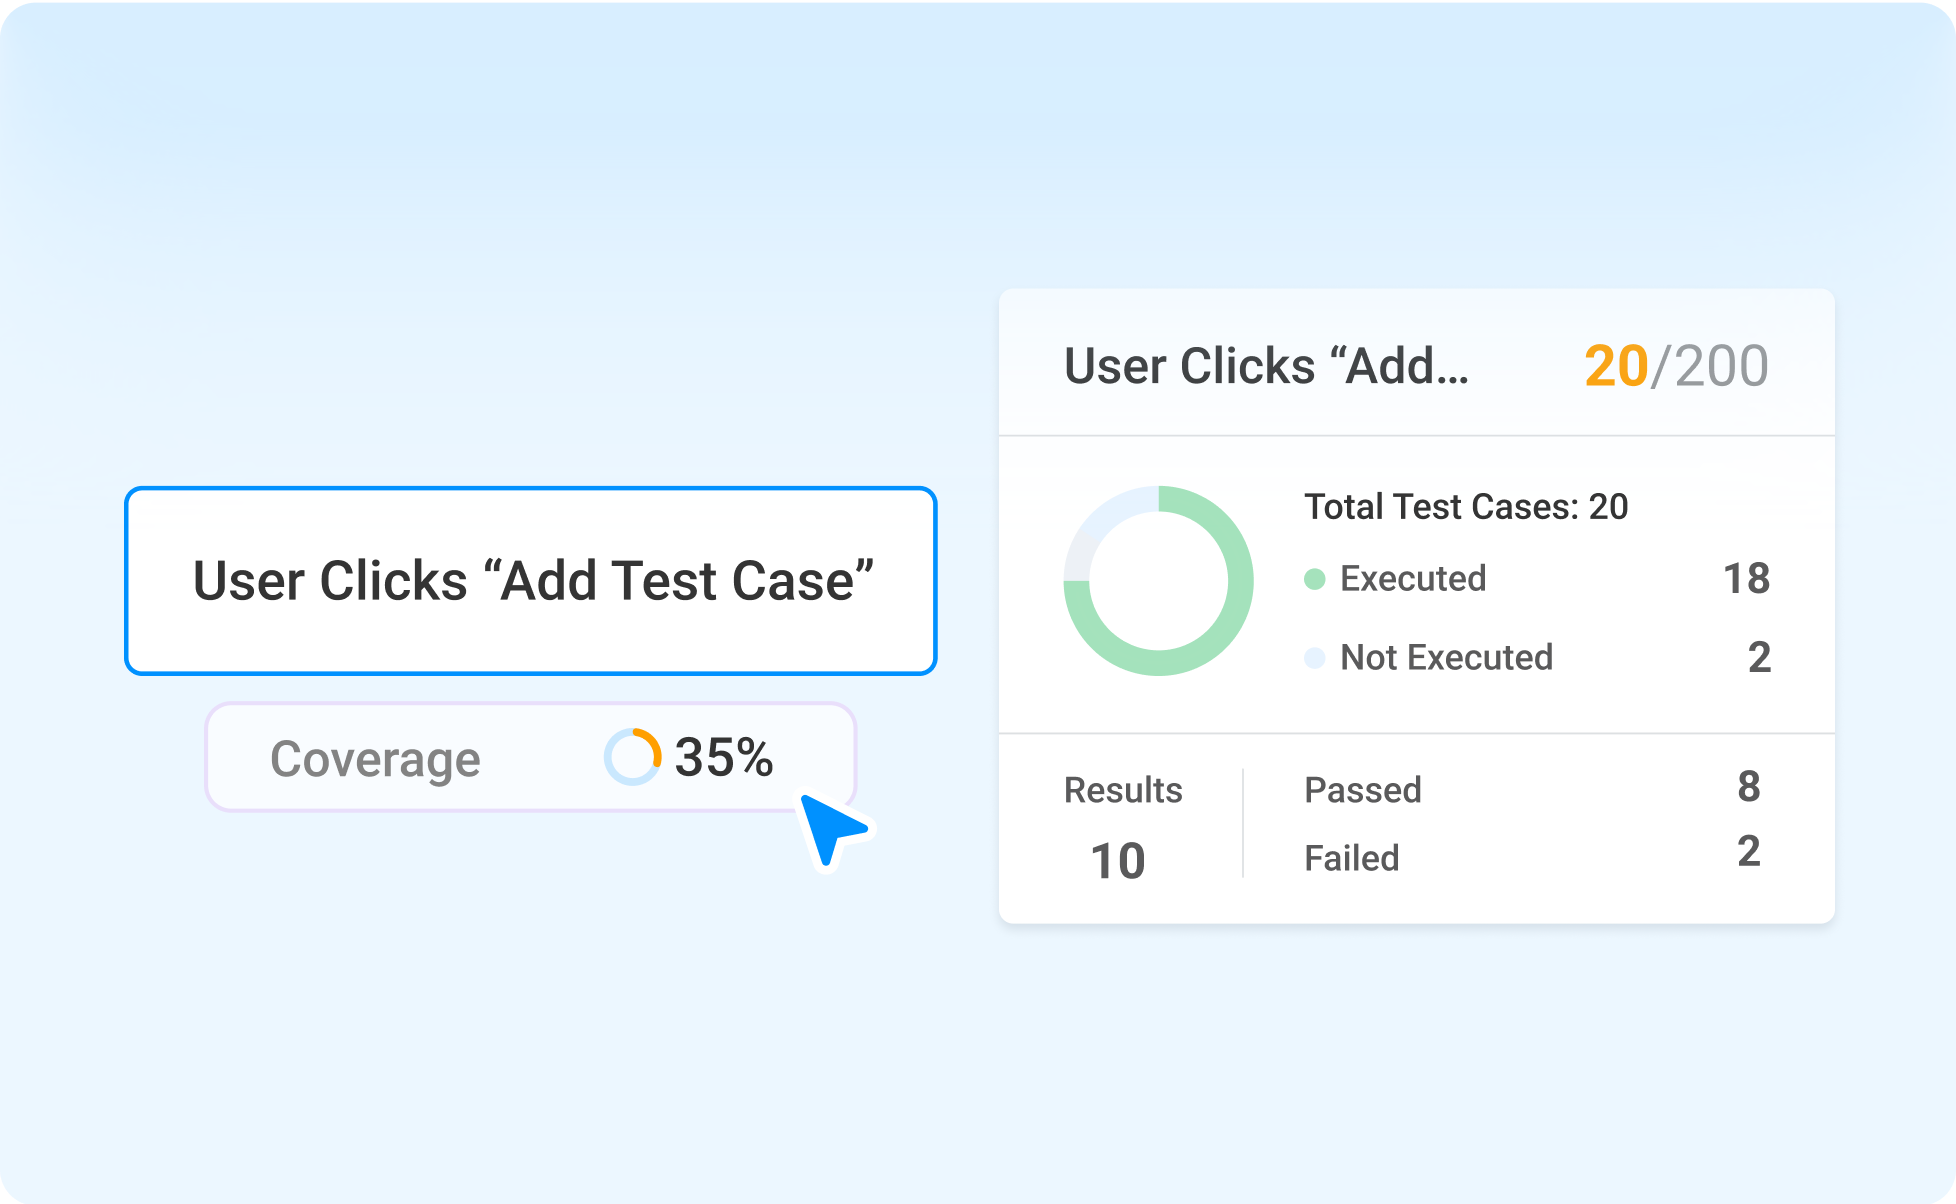
If your test cases are mapped to requirements, Bugasura can build the canvas instantly. Every requirement becomes a stage, every linked test updates health in real time.

icon-upload-document

From documentation to live visibility — automatically.

Canvas Example 2

Edit and Design Your Canvas

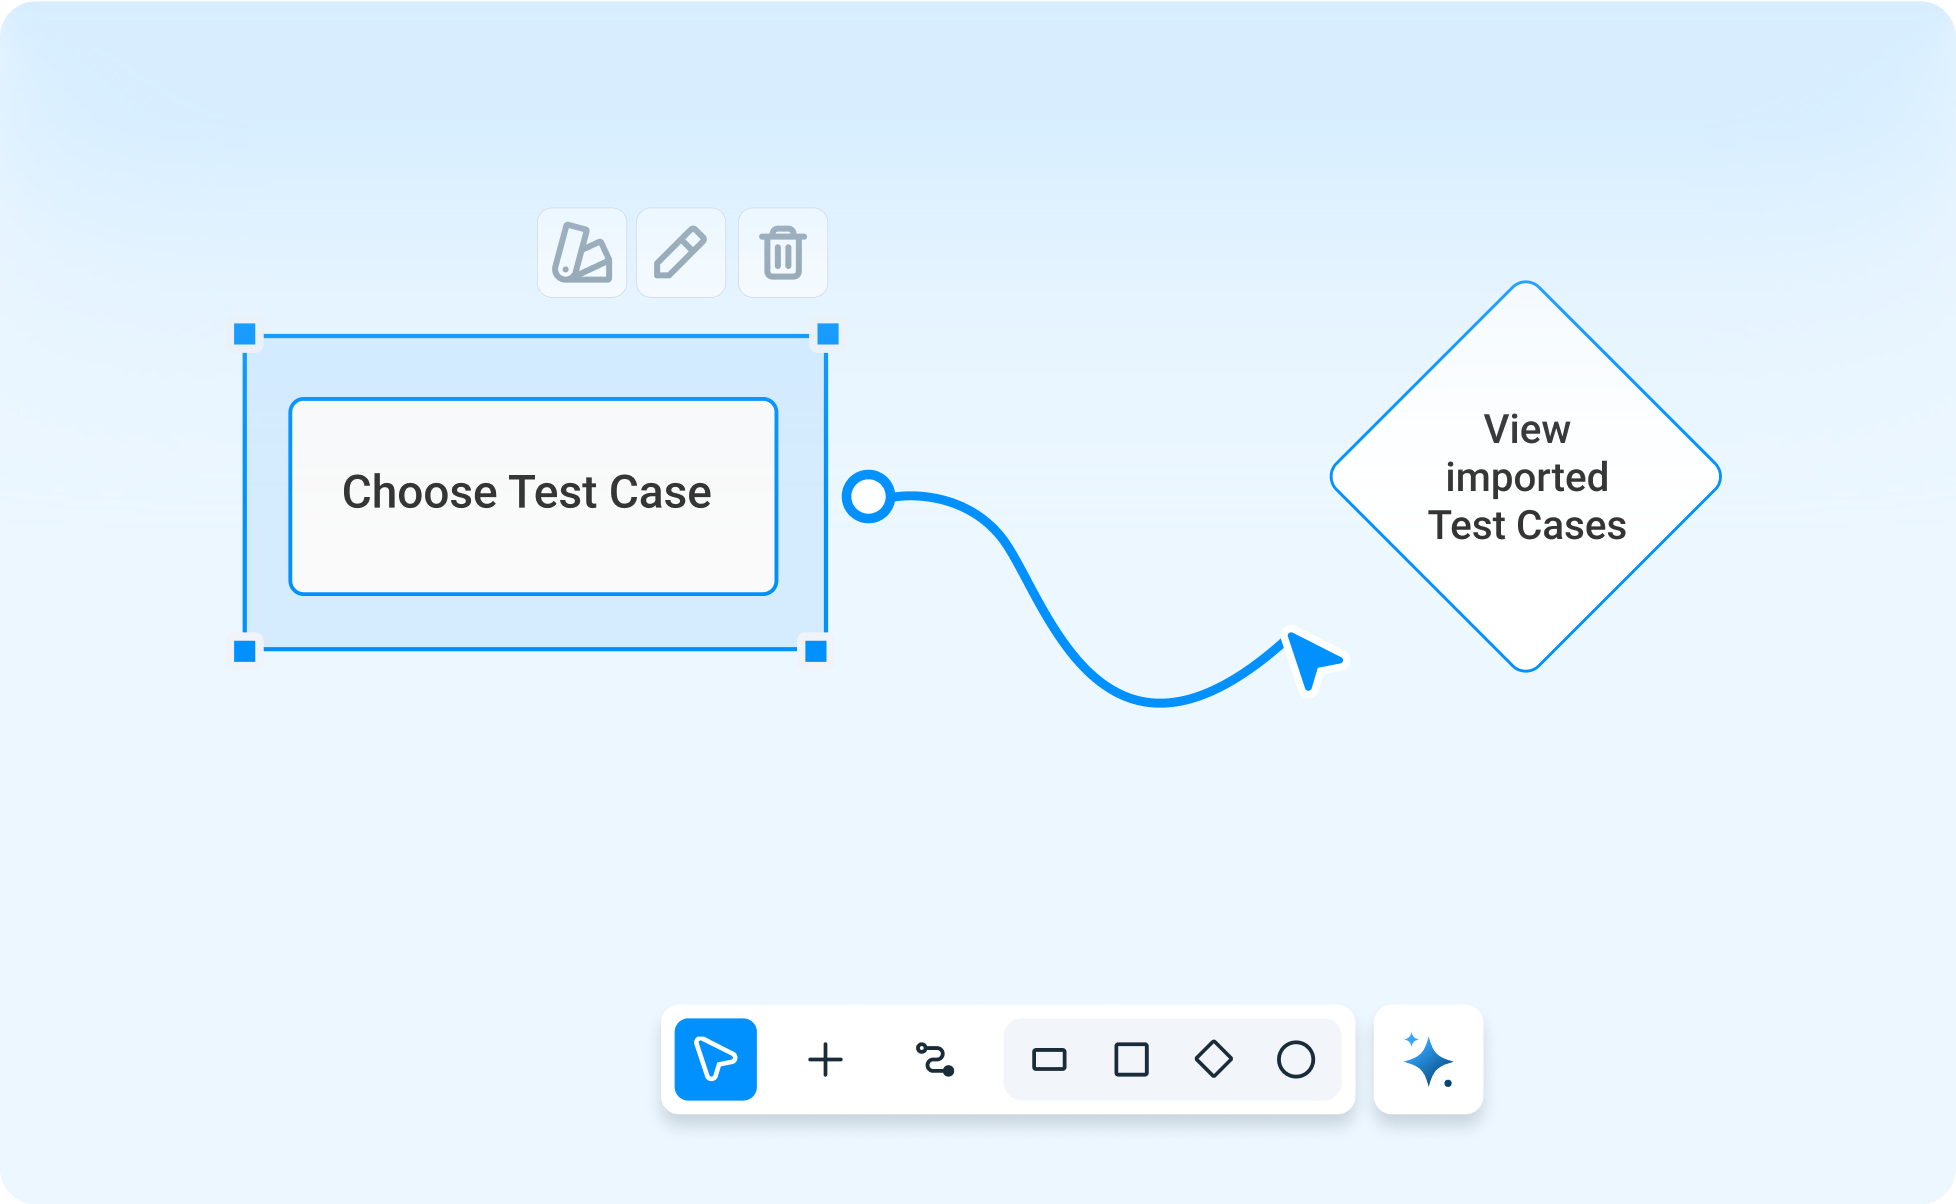
Re-arrange stages, rename nodes, just drag and drop. Add new stages manually from the “+ Draw Toolbar” or let Asura fill the blanks.

Drag & connect nodes Add notes Merge or split stages
icon-upload-document

Feels like FigJam. Works like your product control tower.

Canvas Example 3

Activity Timeline & Progress view

Watch how health changes sprint by sprint. The activity layer shows when coverage improves, when bugs spike, and when you’re truly release-ready.

icon-upload-document

From historical patterns to predictive confidence — all in one glance.

Canvas Example 4

When Red Means Risk Green Means Go

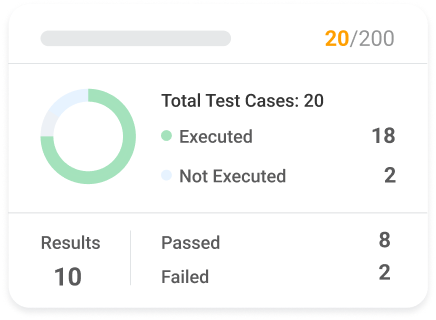
Each stage glows with real-time health signals based on test pass rate and flakiness.

icon-upload-document

Instant visibility into where quality meets revenue risk.

icon-upload-document

One Platform, Zero Swivel-Chair

Test Management

Plan, run, and report tests that feed
your journey health.

Test Management

Issue Tracker

Log, track, and close defects that turn red to green.

Issue Tracker

Bug Reporters

Capture pixel-perfect bugs from web & mobile; context auto attached.

Bug Reporters
Explore The Full Stack

Bugasura vs Other Test Management Tools

  • Pricing
    user/mon

    $0/forever

    $38

    $10

    $10

    $100

    $49

  • Clean, modern UI

    correct-icon
    cross-icon
    cross-icon
    cross-icon
    correct-icon
    correct-icon
  • Free to use

    correct-icon
    cross-icon
    cross-icon
    cross-icon
    cross-icon
    cross-icon
  • Unlimited Users & Projects

    correct-icon
    cross-icon
    cross-icon
    cross-icon
    cross-icon
    cross-icon
  • Requirements Management

    correct-icon
    correct-icon
    correct-icon
    correct-icon
    correct-icon
    correct-icon
  • Manual + API Test Case Authoring

    correct-icon
    correct-icon
    correct-icon
    correct-icon
    correct-icon
    correct-icon
  • Test Suites Flexibility

    correct-icon
    correct-icon
    cross-icon
    correct-icon
    correct-icon
    correct-icon
  • Built-in Reporting

    correct-icon
    correct-icon
    correct-icon
    correct-icon
    correct-icon
    correct-icon
  • Exhaustive API Integrations

    correct-icon
    correct-icon
    correct-icon
    correct-icon
    correct-icon
    correct-icon
  • Fast Setup, No Learning Curve

    correct-icon
    cross-icon
    cross-icon
    cross-icon
    cross-icon
    cross-icon
  • User Journey

    correct-icon
    cross-icon
    cross-icon
    cross-icon
    cross-icon
    cross-icon

Developers QA and Product Owners love Bugasura

loading...