One Report for multiple projects! Introducing Unified Reports Dashboard
Overview
Looking to gather insights on bugs and team members across all your Bugasura projects? We have now released the Unified Reports Dashboard, which is designed to offer a comprehensive overview of issues, and team activities across projects inside Bugasura.
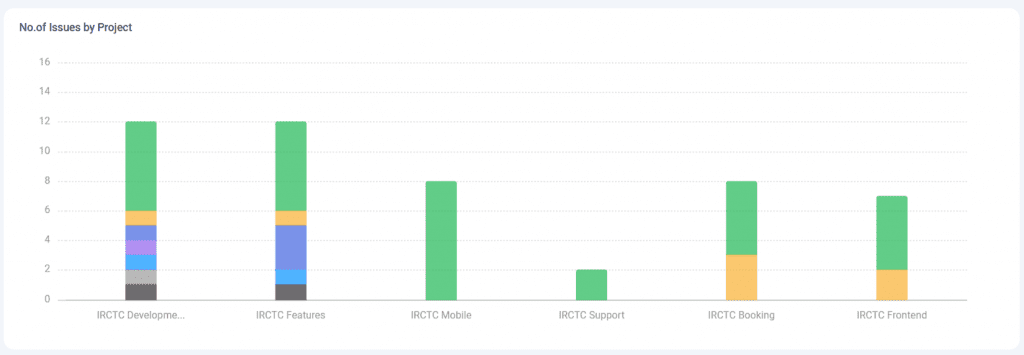
1) No. of Issues by Project: The Unified Reports Dashboard includes a comprehensive tracking mechanism for monitoring the status of issues across projects. Users can easily gauge the progress of tasks through a detailed breakdown of the number of issues in various statuses, including open, closed, in-progress, under review, in design, and any other customized statuses.
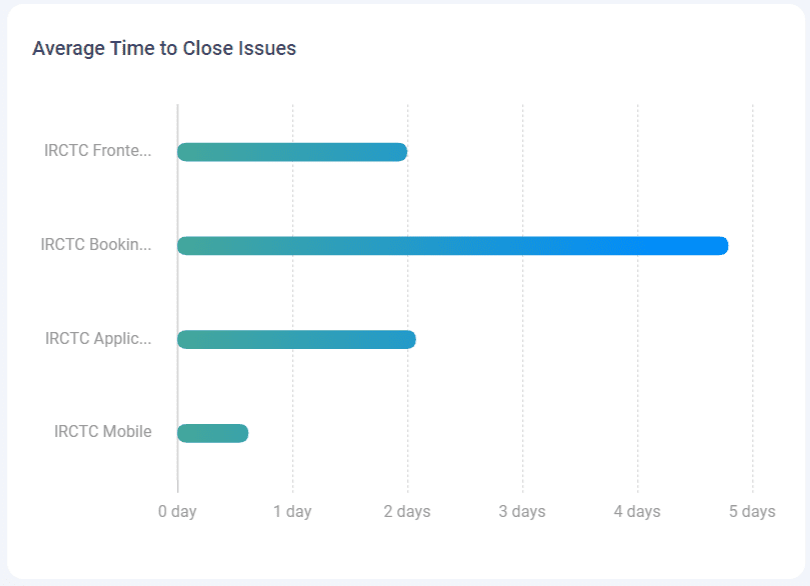
2) Average Time to Close Issues: You also get to track the Average Time to Close Issues in our unified dashboard reports. This widget provides insights into the average time taken to close issues, categorized by projects. Users can now conveniently track the resolution time for various projects within a single dashboard view. The widget enhances project management efficiency by offering valuable metrics for monitoring issue resolution timelines. Keep an eye on this widget to optimize workflow and enhance project delivery.
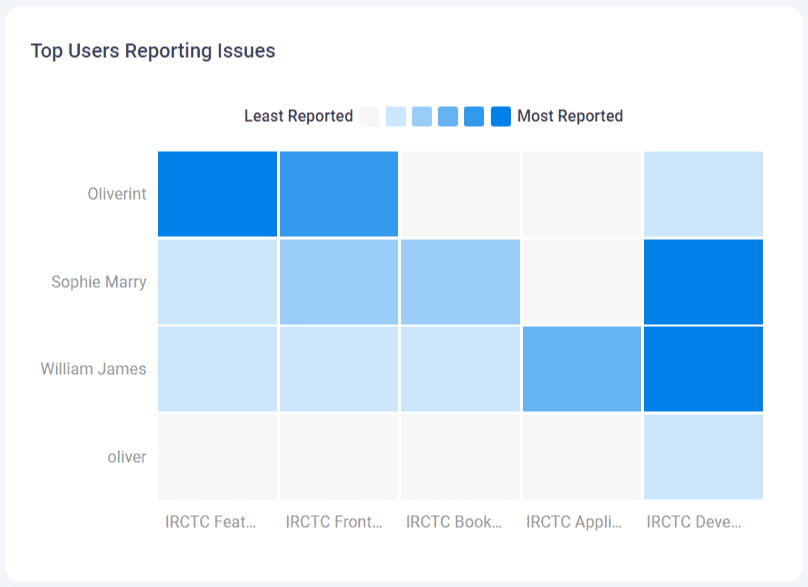
3) Top Users Reporting Issues: This widget displays data based on team members who report the most issues. It provides insights into the most active contributors to issue reporting within the team. This addition enhances our ability to identify key contributors and track issue-reporting trends effectively.
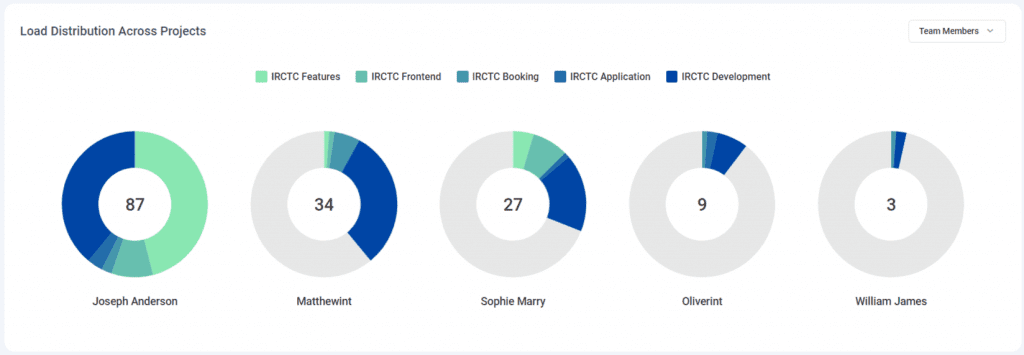
4) Load distribution Across projects: Get a robust load distribution snapshot with this report. It offers insights into the allocation of tasks and responsibilities among team members. This feature is further refined by segregating the load distribution based on specific projects, providing a detailed breakdown of user contributions across different assignments.
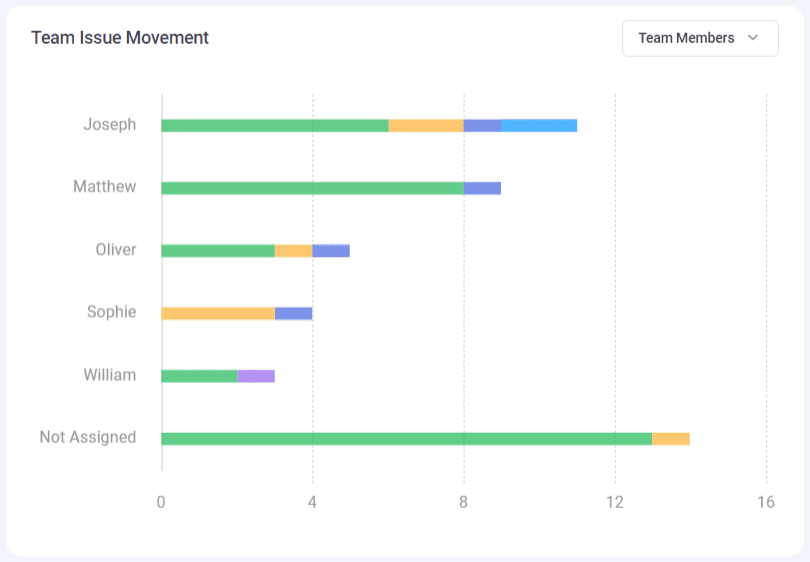
5) Team Issue Movement: The Unified Reports Dashboard now includes a powerful functionality that allows users to analyze and track the movement of issues on a per-team-member basis. This segmentation provides a granular understanding of each team member’s impact on issue resolution and project progression.
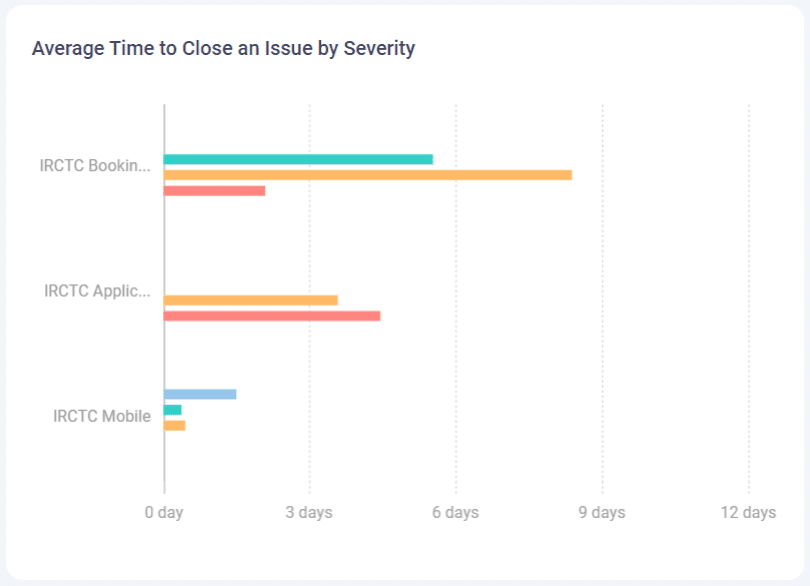
6) Average Time to Close an Issue by Severity: This widget provides valuable insights into how long it takes to resolve different types of issues based on their severity levels. With this addition, users can better understand the average time it takes to address issues of varying severity, helping teams prioritize and manage their tasks more effectively. It enhances our dashboard’s analytical capabilities, empowering users to make data-driven decisions to improve issue resolution times.
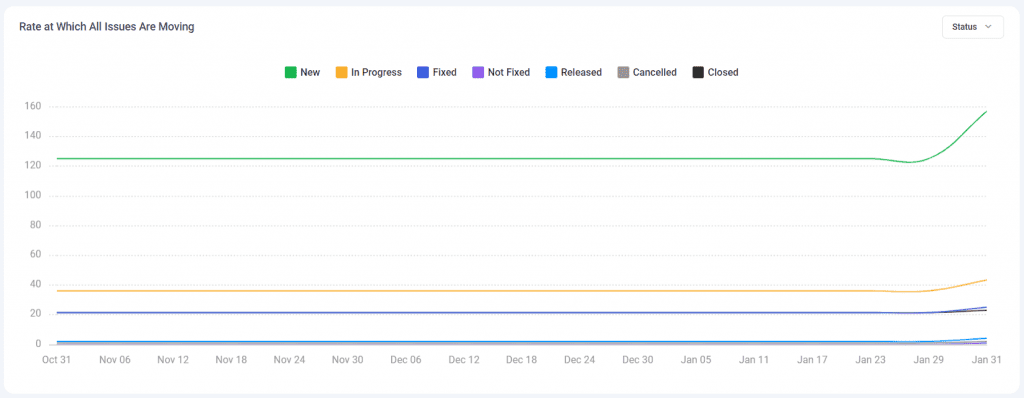
7) Rate at Which All Issues Are Moving: You can also track dynamic metrics like the rate at which all issues are moving within your projects. This feature is essential for assessing the overall project health and identifying trends in issue resolution speed.
Why Should You Use Unified Reports Dashboard?
- Gain a consolidated view of team activities, issue statuses, load distribution, and individual contributions in one centralized location.
- Achieve peak efficiency by identifying and addressing workload imbalances through the Load Distribution of Users feature.
- Foster collaboration and accountability with Team Issue Movement Segregated by Team Members, providing insights into individual contributions.
How to enable and use Unified Reports Dashboard?
To utilize the Unified Reports Dashboard effectively, follow these steps
- Gain insights project-wise with the “No. of Issues by Project” Chart.
- Helps teams track and analyze the time taken to resolve issues with the “Average Time to Close Issues” Chart.
- Identifies the most active contributors to issue reporting within the team with the “Top Users Reporting Issues” Chart.
- Optimize resource efficiency with the “Load Distribution Across Projects” Chart.
- widget provides insights into issue resolution times based on severity levels with the “Average Time to Close an Issue by Severity” Chart.
- Foster collaborative efficiency with the “Team Issue Movement” Chart
- Real-time progress insights with the “Rate at Which All Issues Are Moving” Chart.
You can set up unlimited projects even on the FREE plan of Bugasura. Explore private and public projects and streamline all your bugs easily in one place.